Decarbonization

Cut emissions. Save energy. Maximize ROI.

We turn operational inefficiencies into measurable climate action.

Green lightning bolt icon
Energy Reduction
7- 0

%

Green CO2 cloud with downward arrow symbolizing carbon reduction.
Carbon Reduction
0

%

Green circular arrow symbol represents return on investment.
ROI
2- 0

Years

Our Approach

We combine advanced technology with proven strategies to deliver measurable decarbonization results.

Target the Right Assest

Target icon representing focus on high energy-consuming systems.

Focus on HVAC, Chillers, Pumps, and Lighting; your top energy consumers

Magnifying glass with checkmark icon symbolizing carbon hotspot identification.

Identify Carbon hotspots across utility systems

Cross inside circle symbolizing avoidance of unnecessary capital expenses.

Avoid capex-heavy changes with data-led operational fixes

HVAC outdoor unit showing cooling fan.
People reviewing business charts and reports on a table.
Industrial piping with pressure gauge in a utility system.

Measurable Results

Hand with energy bubble icon represents 7-30% energy savings across key systems.

7-30% energy savings across key systems

Badge icon with check mark symbol represents verified scope 1 & 2 emission reductions

Verified Scope 1 & 2 emission reductions

Magnifying glass analyzing bar chart icon symbolizing performance tracking.

Continuous performance tracking for ESG and CDP Compliance

Colorful digital chart with financial and energy performance graphs.
Hand holding ESG hologram with icons for people, money, and sustainability.

Immediate Impact

Light bulb and gear icon with circular arrows, represents fast implementation and minimal disruption.

Fast implementation, minimal disruption

Icon of a light bulb with a checkmark inside, surrounded by a gear, representing OEM-agnostic.

OEM-agnostic integration with your existing infrastructure

Magnifying glass analyzing bar chart and data points, representing monitoring and performance tracking

Fully automated dashboard and reports for transparency and audits

People reviewing business charts and reports on a table.
Industrial facility with pipes and chimneys at sunset.
Energy and asset management platform OptiByte showing performance data

Ready to start your Decarbonization journey?

Frequently Asked Questions

These FAQs cover the strategies, technologies, and system improvements that help facilities cut emissions and advance their decarbonization goals.

1. What industries benefit from your decarbonization services?

Manufacturing, commercial buildings, healthcare, and educational campuses.

2. Do you only focus on energy reduction?

No, we address energy, process optimization, and equipment upgrades.

3. How are results verified?

Through baseline comparison and IPMVP-compliant M&V.

4. What’s the role of digital tools here?

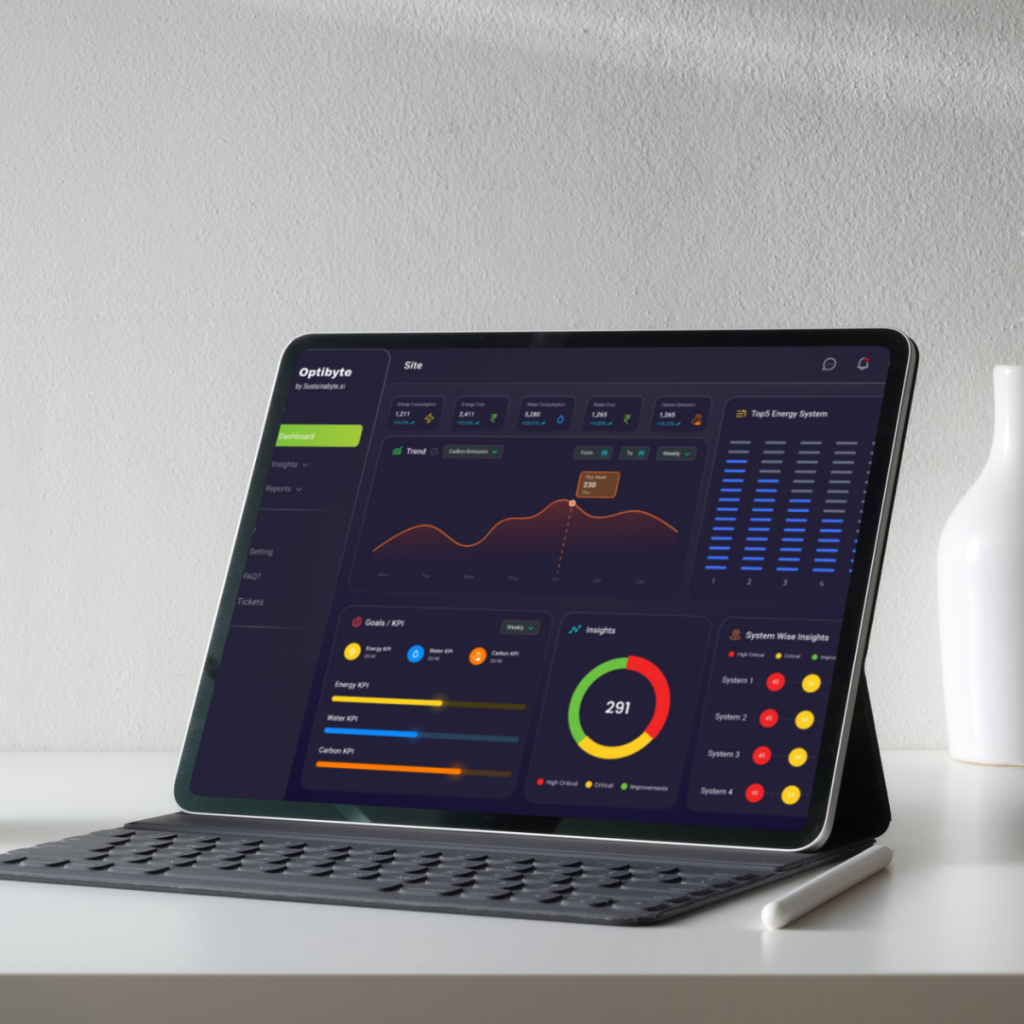
OptiByte provides live tracking and performance benchmarking.

5. Can decarbonization projects attract green financing?

  1. Yes, verified data supports eligibility for sustainability-linked funding.

Clients